
Introduction: The Analytical Imperative - Why We Measure Efficiency
Goals win games—that’s a fact that drives every hockey fan. But raw goal totals are just the surface. If you want to understand how reliably a player contributes, and truly predict future success, you need to go deeper: you need to measure efficiency.
Our inaugural analysis dives into David Pastrnak’s impact on the Boston Bruins’ power play. Using advanced metrics sourced from MoneyPuck.com, we weren’t just looking for goals; we were searching for the true, sustainable production rate of his shifts versus the team’s average. The results? They’re conclusive. Pastrnak isn’t just a part of the power play; he’s the engine that transforms it into a scoring machine, dominating the opposition on a Per 60 minute basis.
The Problem, The Fix, and The Core Conclusion — Efficiency is Our Edge
Our journey began with a fundamental challenge: accurately measuring Pastrnak’s unique impact. It’s easy to say he’s good, but proving how much better he makes his unit requires analytical rigor. We quickly hit a critical hurdle that many public analytics overlook:
The Contamination Problem: We couldn’t simply compare Pastrnak’s stats to the average of his teammates stats. Why? Because most players on the Bruins’ power play would have some ice time with Pastrnak, contaminating their individual numbers and making the comparison unfair.
The Solution: We engineered a “Contamination Fix.” By utilizing three distinct MoneyPuck datasets—team-level 5v4 ice time, individual skater rates (including Pastrnak’s), and raw shot data—we mathematically isolated the true, uncontaminated ice time for every minute Pastrnak wasn’t on the ice during a 5v4 situation. This allowed us to build a precise, apples-to-apples comparison between his unit and the rest of the team’s power play efforts.
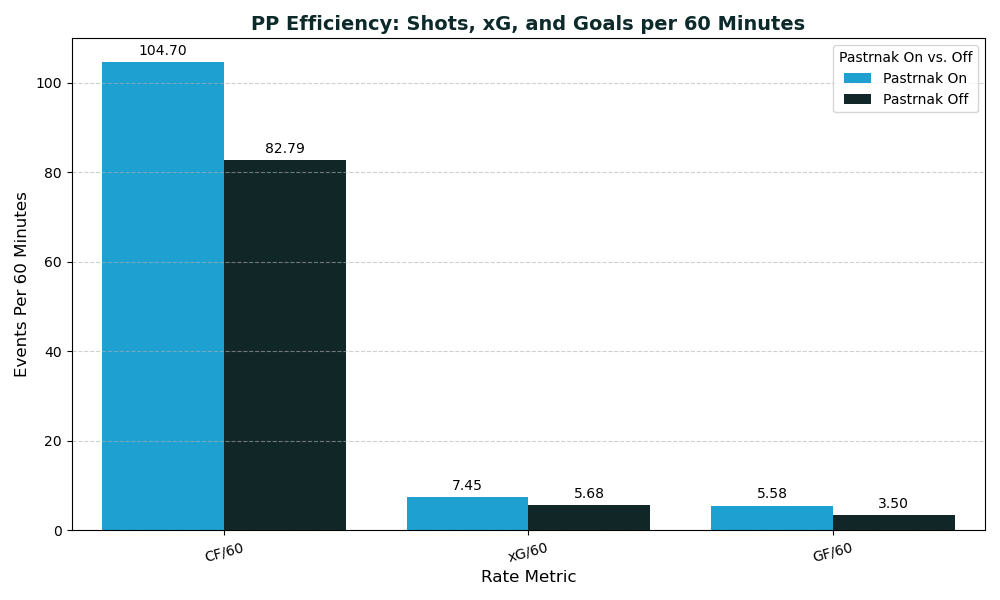
With that analytical integrity secured, we standardized the performance of Pastrnak’s primary unit (Unit 1) against this rigorously calculated “Rest of PP Time” (our 2nd Unit Proxy) using three crucial Per 60 Minute rates. Here’s what we found:
| Metric (Per 60 Min) | Pastrnak On Ice (1st Unit Time) | Rest of PP Time (2nd Unit Proxy) | Why This Matters (Analytical Conclusion) |
|---|---|---|---|
| Expected Goals (xG/60) | 7.45 | 5.68 | Quality Control: With Pastrnak on the ice, there are 1.77 more higher-quality scoring chances every 60 minutes. |
| Goals For (GF/60) | 5.58 | 3.50 | Lethality Confirmed: Pastrnak's unit converts chances into goals at a faster rate. |
| Corsi For (CF/60) | 104.70 | 82.79 | Puck Dominance: Maintains higher shot volume and offensive control. |
The Actionable Insight: This isn't about one good player; it's about a player who fundamentally improves the entire team's power play structure. Pastrnak’s higher xG/60 rate proves the offensive blueprint is inherently better when he's on the ice. He’s the structural engine driving a higher volume of higher-quality chances, leading to more goals. This efficiency isn't just good for the Bruins; it's the foundation for any serious fan or recruiter evaluating true offensive impact.
The Visual Evidence - Footprint of a Power Play Quarterback
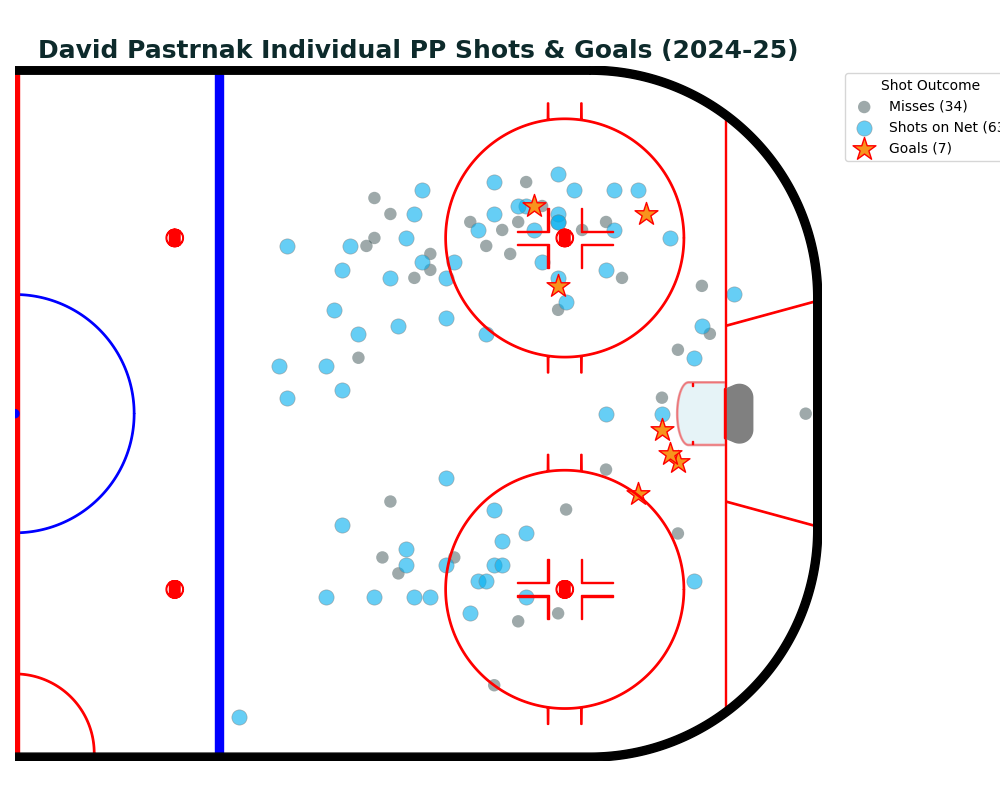
The Shot Map visually confirms the analytical conclusions of the xG/60 rate by showing precisely where Pastrnak focuses his individual attack during 5v4 situations (displaying only his shots, misses, and goals).
The Go-To Trend: Look closely at the extreme clustering of shots and goals in the high slot and top of the left circle. This isn’t random; it’s Pastrnak’s “office”—the most dangerous and difficult area for goaltenders to defend due to direct shooting lanes and multiple passing options.
So What?: This map is crucial strategic intelligence. It verifies Pastrnak’s consistent location and high-danger tendencies. For an opposing coach, this data screams: “Your defensive strategy must prioritize blocking that high slot position and pressuring him in that zone.” It dictates their entire tactical approach.
Our Data Journey: Creating this map wasn’t just plotting points. We had to implement a complex coordinate transformation logic to flip all raw x/y coordinates onto a single offensive end, ensuring the visual was accurate and interpretable, regardless of which net the shot was originally taken on.
Beyond the First Shift
This project is more than just an analysis; it’s the foundational “First Shift” and our commitment to data-driven insights. It proves not only what we can find, but how we approach complex data challenges:
Transparency & Analytical Integrity: We successfully sourced and utilized advanced metrics from MoneyPuck.com and, crucially, engineered a solution to the “Contamination Problem”—ensuring our comparisons are analytically sound. This entire process, including our Python code, analytical fixes, and raw data files, is fully documented on my GitHub. It demonstrates a commitment to rigorous methodology.
Predictive & Future Value (For Fans & Future Growth): By quantifying Pastrnak’s elite xG/60 performance and understanding his tendencies, we establish a reliable performance benchmark. This foundation is essential for future projects: with a goal of eventually building robust predictive models to forecast goal probability, evaluate player value (e.g., “Value Per Dollar”), and even identify optimal line combinations.
Our Journey Continues: This project highlights my personal journey transitioning into data analytics. From identifying data flaws to implementing custom solutions in Python and presenting clear, actionable insights, this project underscores the problem-solving and technical skills I look forward to continuing to build upon.
This is just the first shift. Follow Next Shift Analytics as we turn raw data into actionable foresight.
View the complete code, the analytical solutions, and the raw data files used for this project on: